SEAL
I was chosen by the University of Washington's Sensors, Energy & Automation Laboratory to redesign the internal dashboard its 300+ engineers rely on, consolidating a fragmented, multi-spreadsheet system into one intuitive interface. I owned the project end-to-end, reporting to the web design team lead and running usability testing on every iteration.
- Timeline
- Jun – Aug 2025 (3 months)
- Role
- UX/UI Designer Intern
- Team
- Solo · reported to Web Team Lead
- Tools
 Figma
New-member retention was low, and everyday lab workflows were difficult to navigate.
Productivity and project development in the lab were slower than expected, and members reported real difficulty navigating the internal dashboard, a multi-sheet process that created confusion and slowed everyone down.
The lab faced low new-member retention alongside frustration with its fragmented system. Members struggled to organize tasks, find projects, schedule meetings, and access team information and resources. Experienced members relied on personal workarounds that were difficult to teach. The redesign focused on helping members get started and contribute with less confusion.
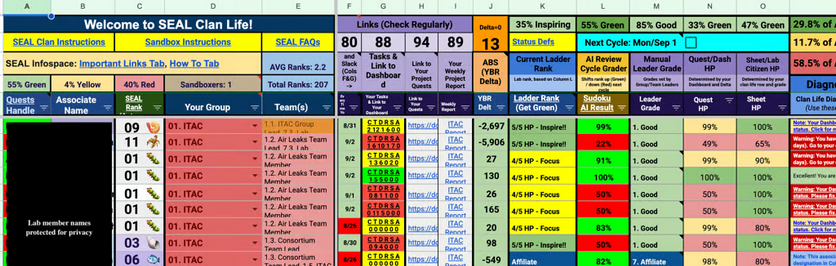

Critical navigation and workflow inefficiencies
hindered productivity.
I conducted five in-depth interviews and extensive usability testing, which surfaced four significant pain points in the existing dashboard, each one measurably eroding daily productivity and satisfaction.
Multi-sheet navigation cost productivity
Users spent 30+ seconds on simple tasks like locating team information, lost to unclear naming conventions and a fragmented spreadsheet system.
43% task failure rate for simple workflows
To find project info and understand lab requirements, users built workarounds instead of using the existing interface.
Low baseline satisfaction (3/10)
Users described the navigation as having "no system," especially punishing for newer lab members.
Cognitive overload
Juggling multiple open spreadsheets and constant switching disrupted natural workflow patterns and decreased efficiency.
Three layout directions tested what members needed at a glance.
I brought wireframes back to lab members after every round. Instead of committing to the first comprehensive dashboard, I compared different ways to prioritize scheduling, navigation, tasks, and lab status so the structure would reflect real workflows rather than my assumptions.
Iteration 1: one dashboard, three approaches
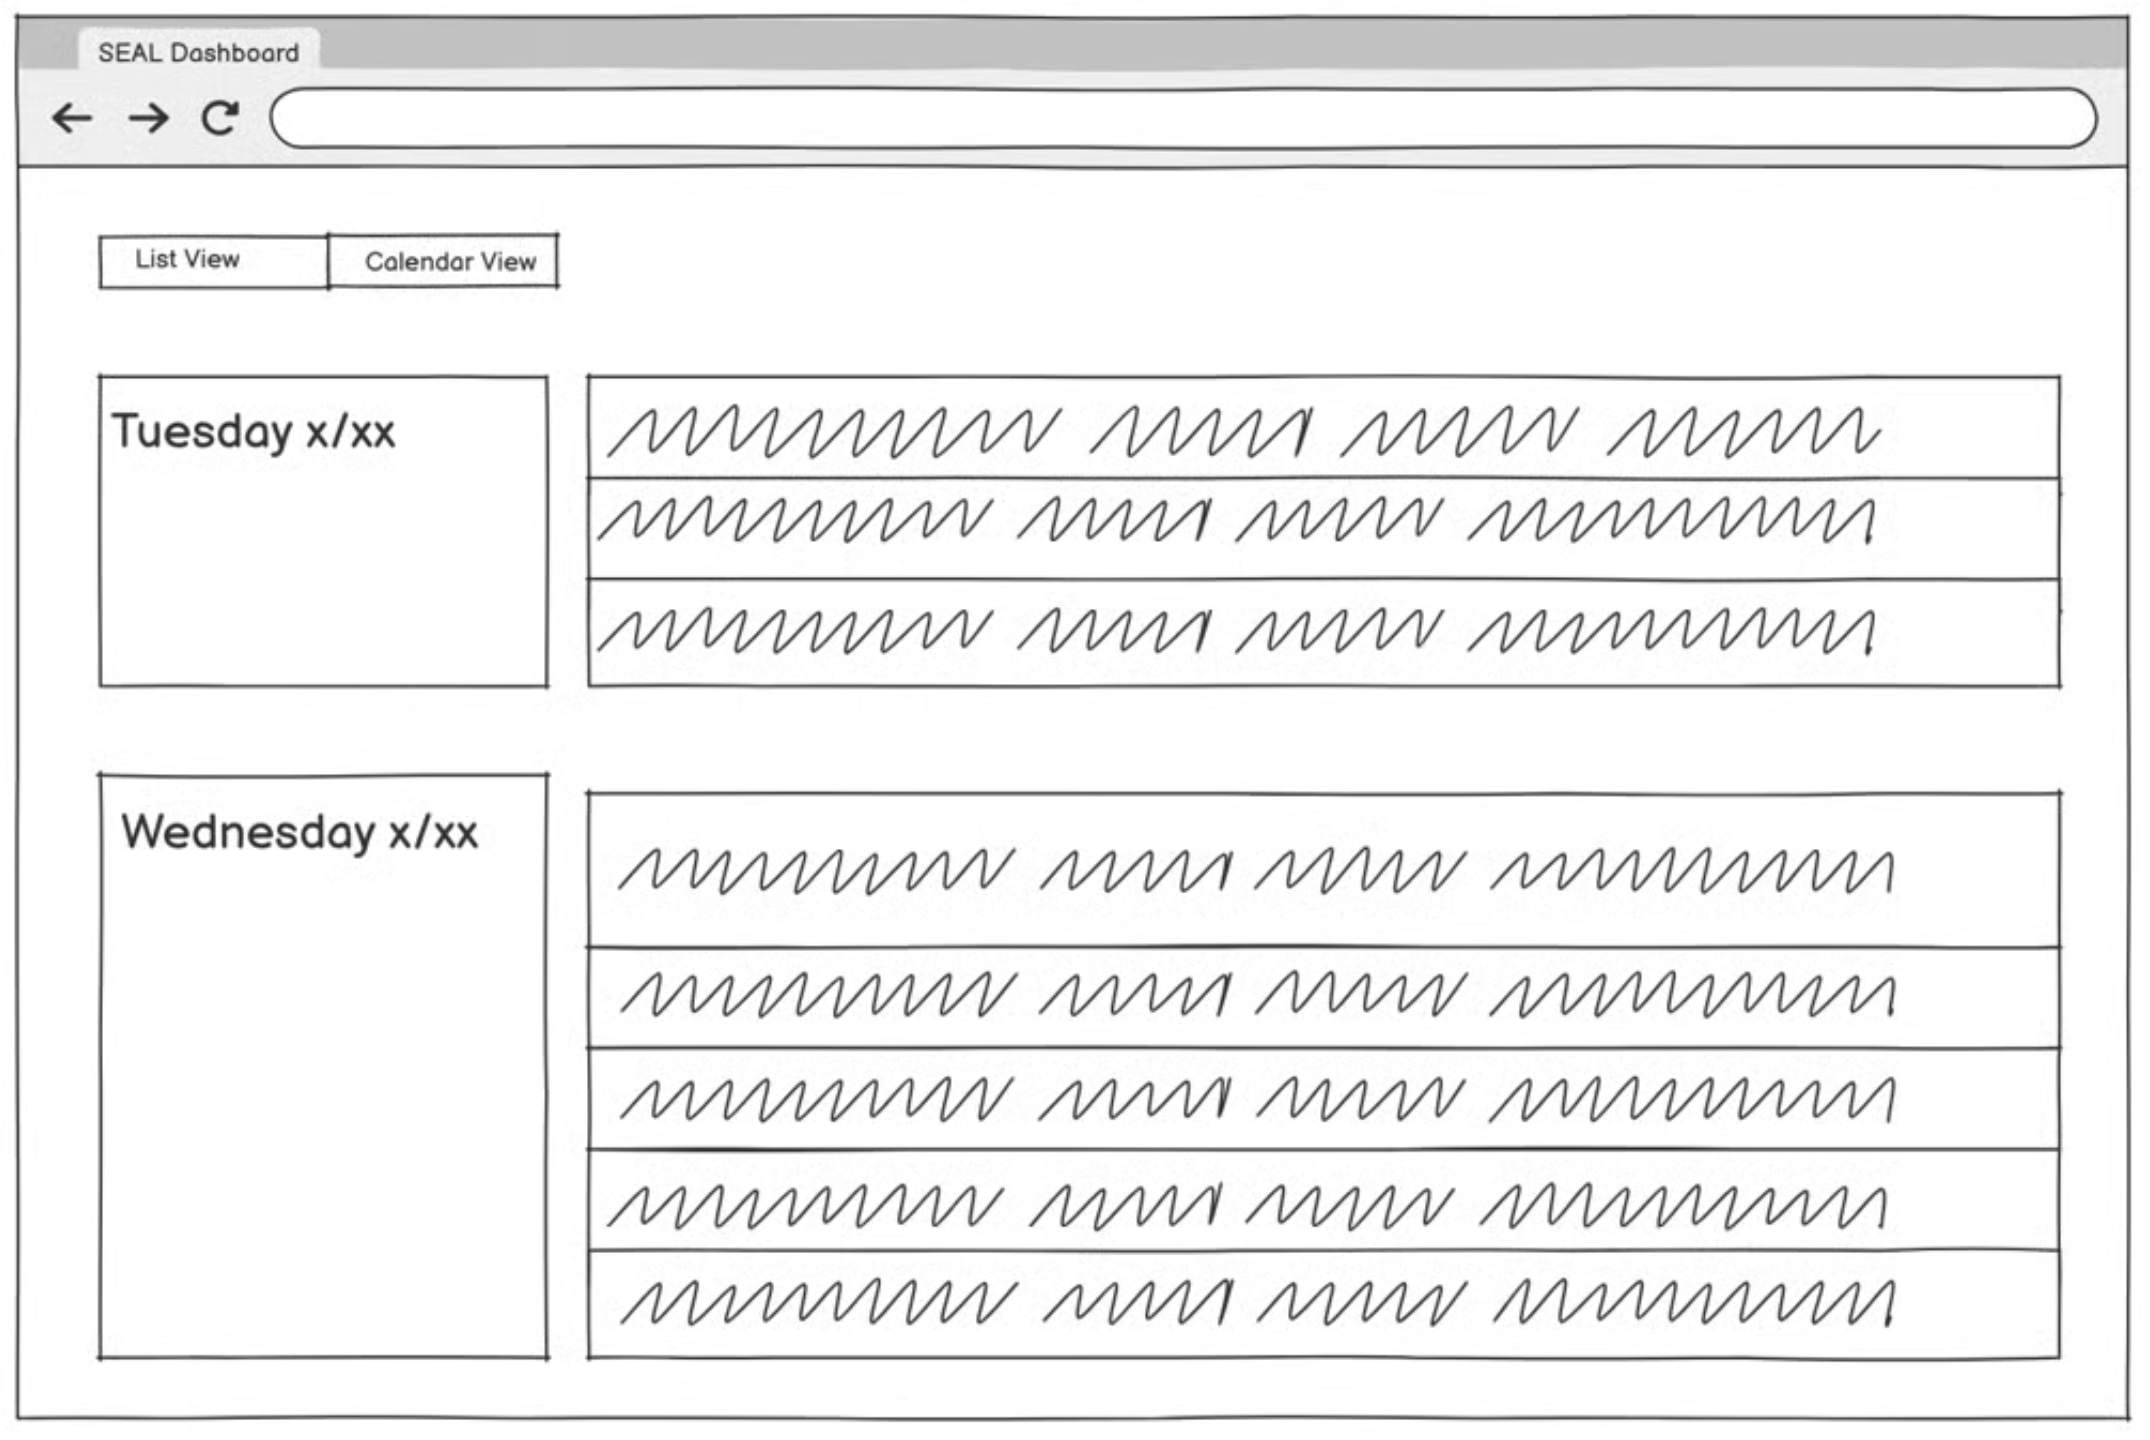
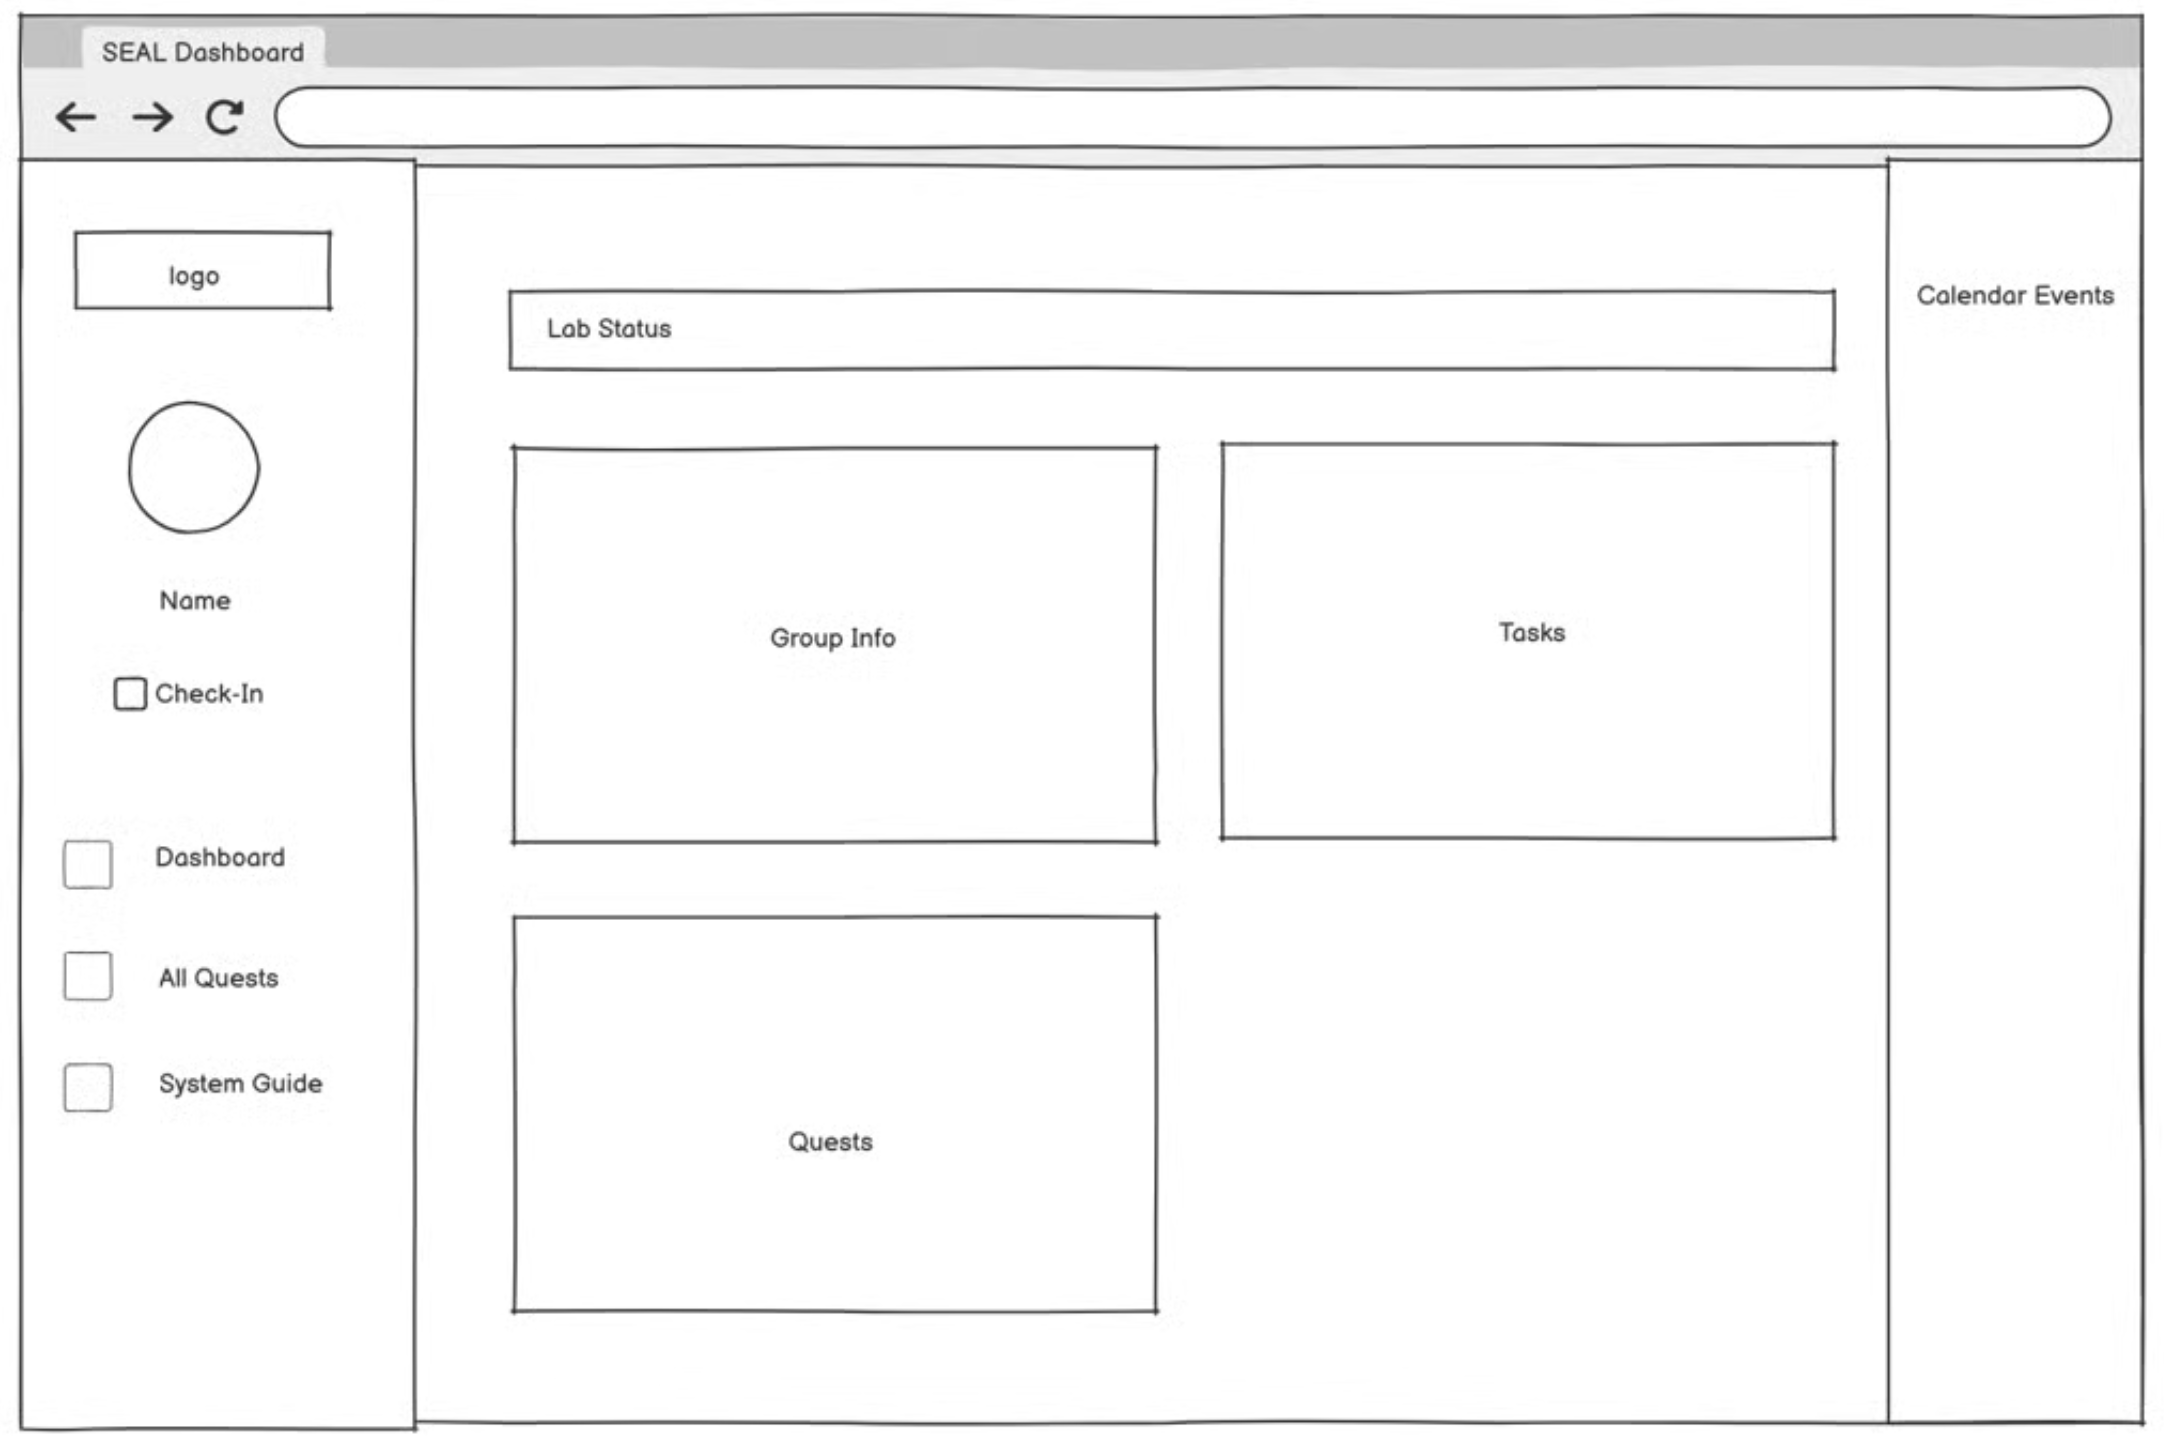
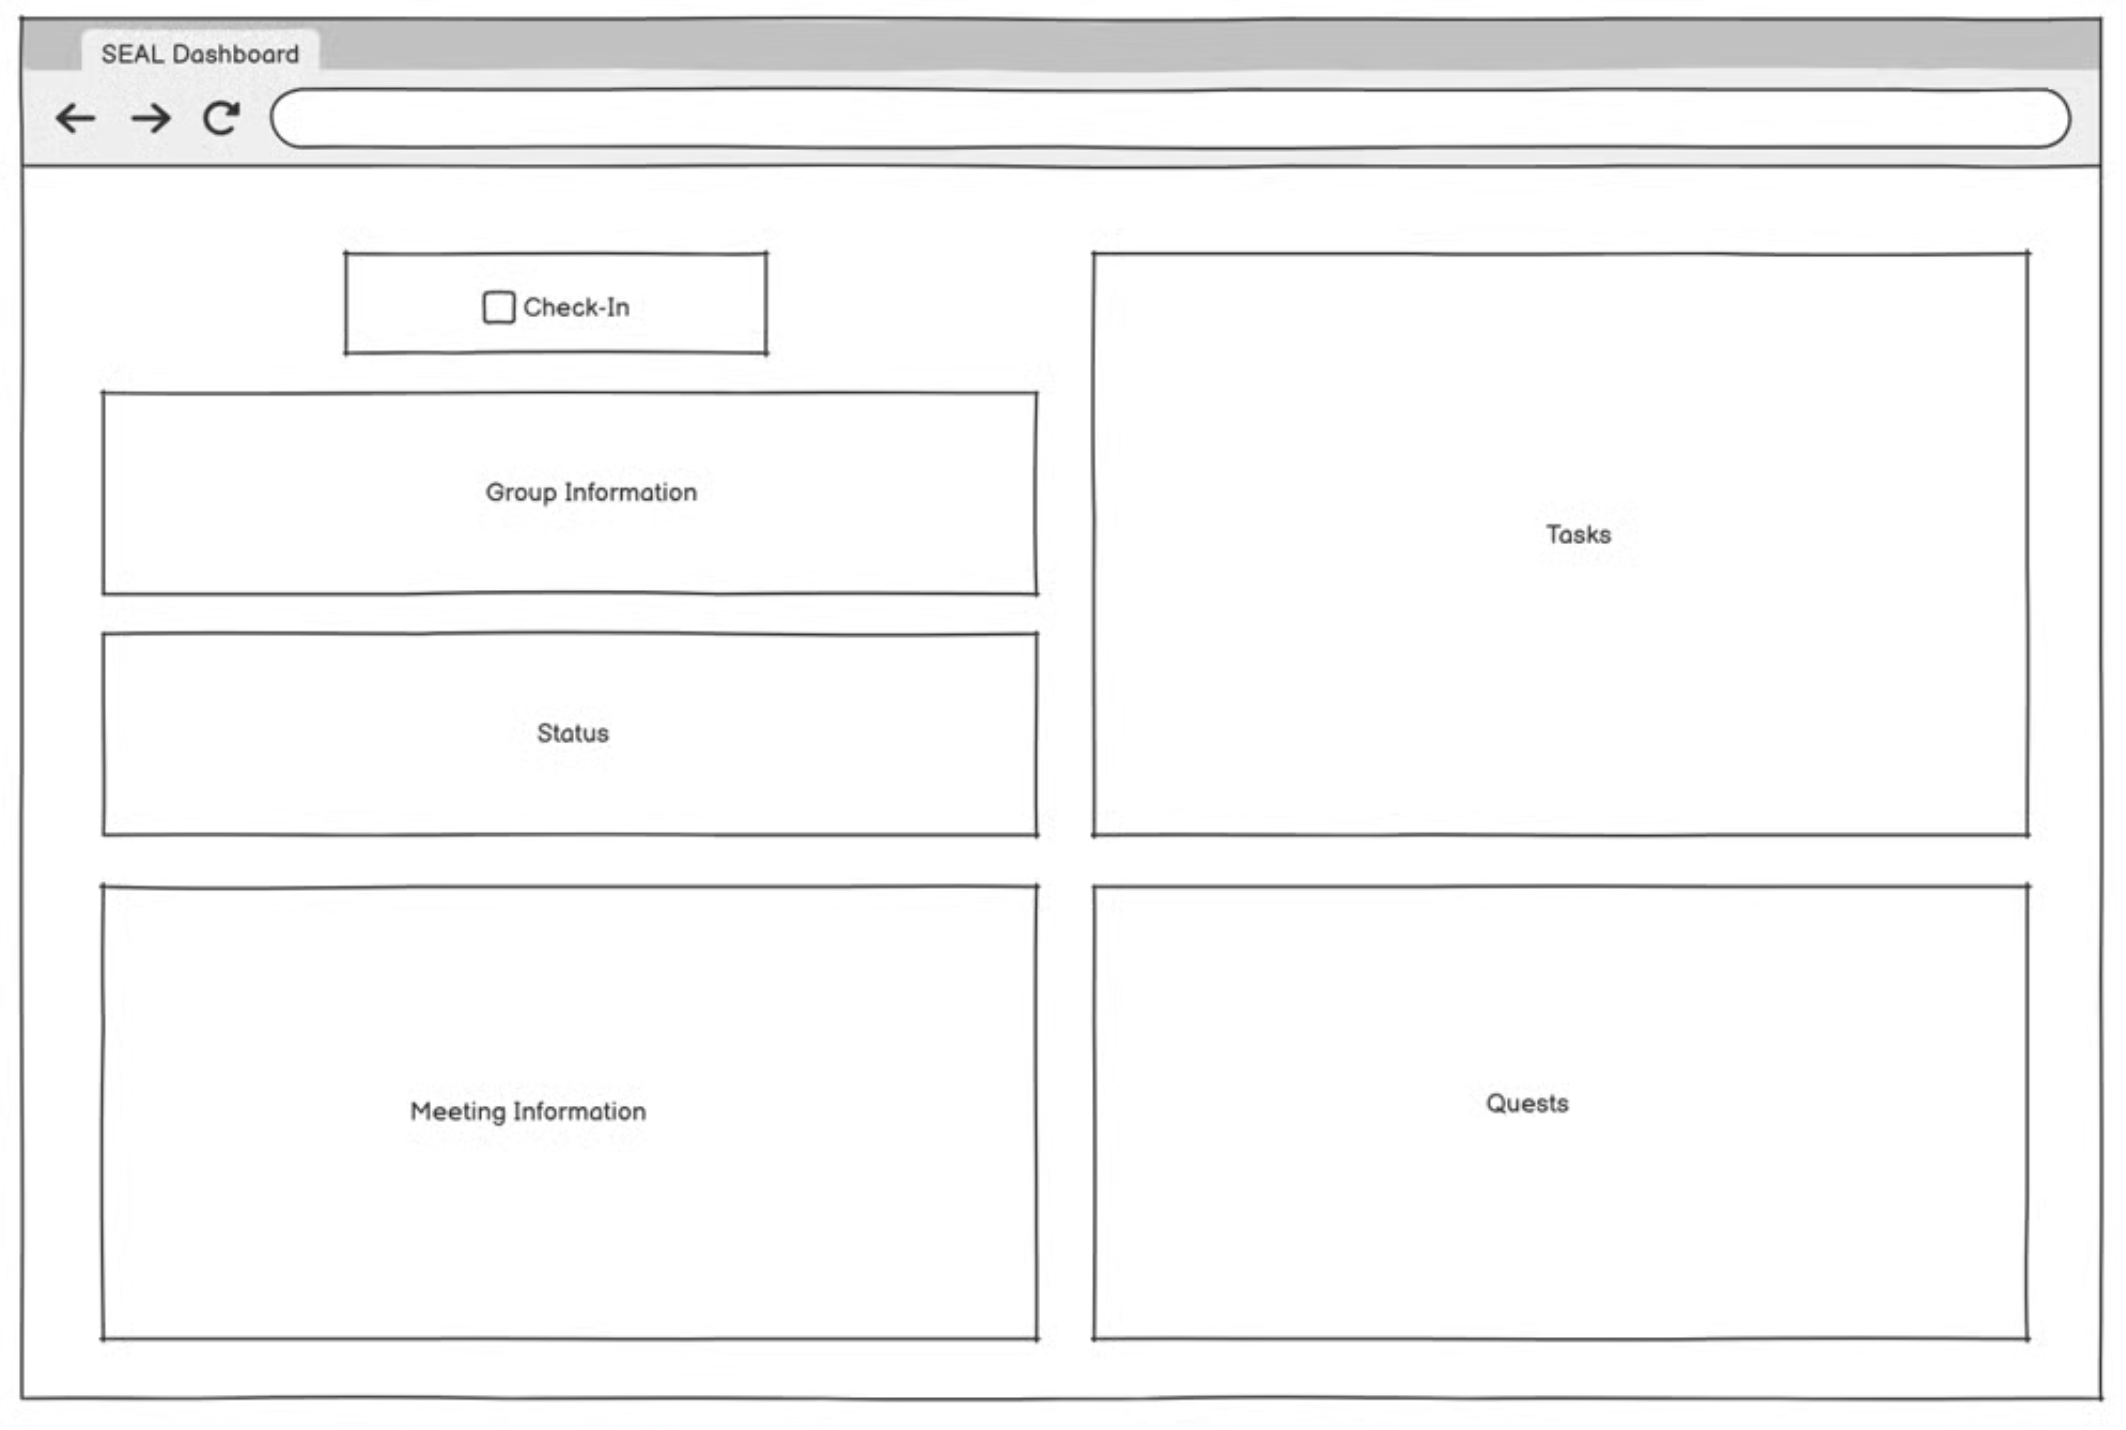
I tested three ways of organizing the same workflows: a schedule-first view, a dashboard with persistent navigation, and a modular overview emphasizing tasks and lab status. Comparing them helped me move away from reproducing the spreadsheet structure and toward a single starting point where members could understand what needed their attention before moving into a detailed task.
Iteration 2: clarity over decoration
The first direction reserved space for a personal profile. Testing showed that members did not come to the dashboard to manage their identity. They needed to understand their status, tasks, meetings, and projects. I deprioritized the profile and used the interface to make more workflow information visible at first glance, helping members understand both what they needed to do and how their performance was evaluated.
The resulting information architecture
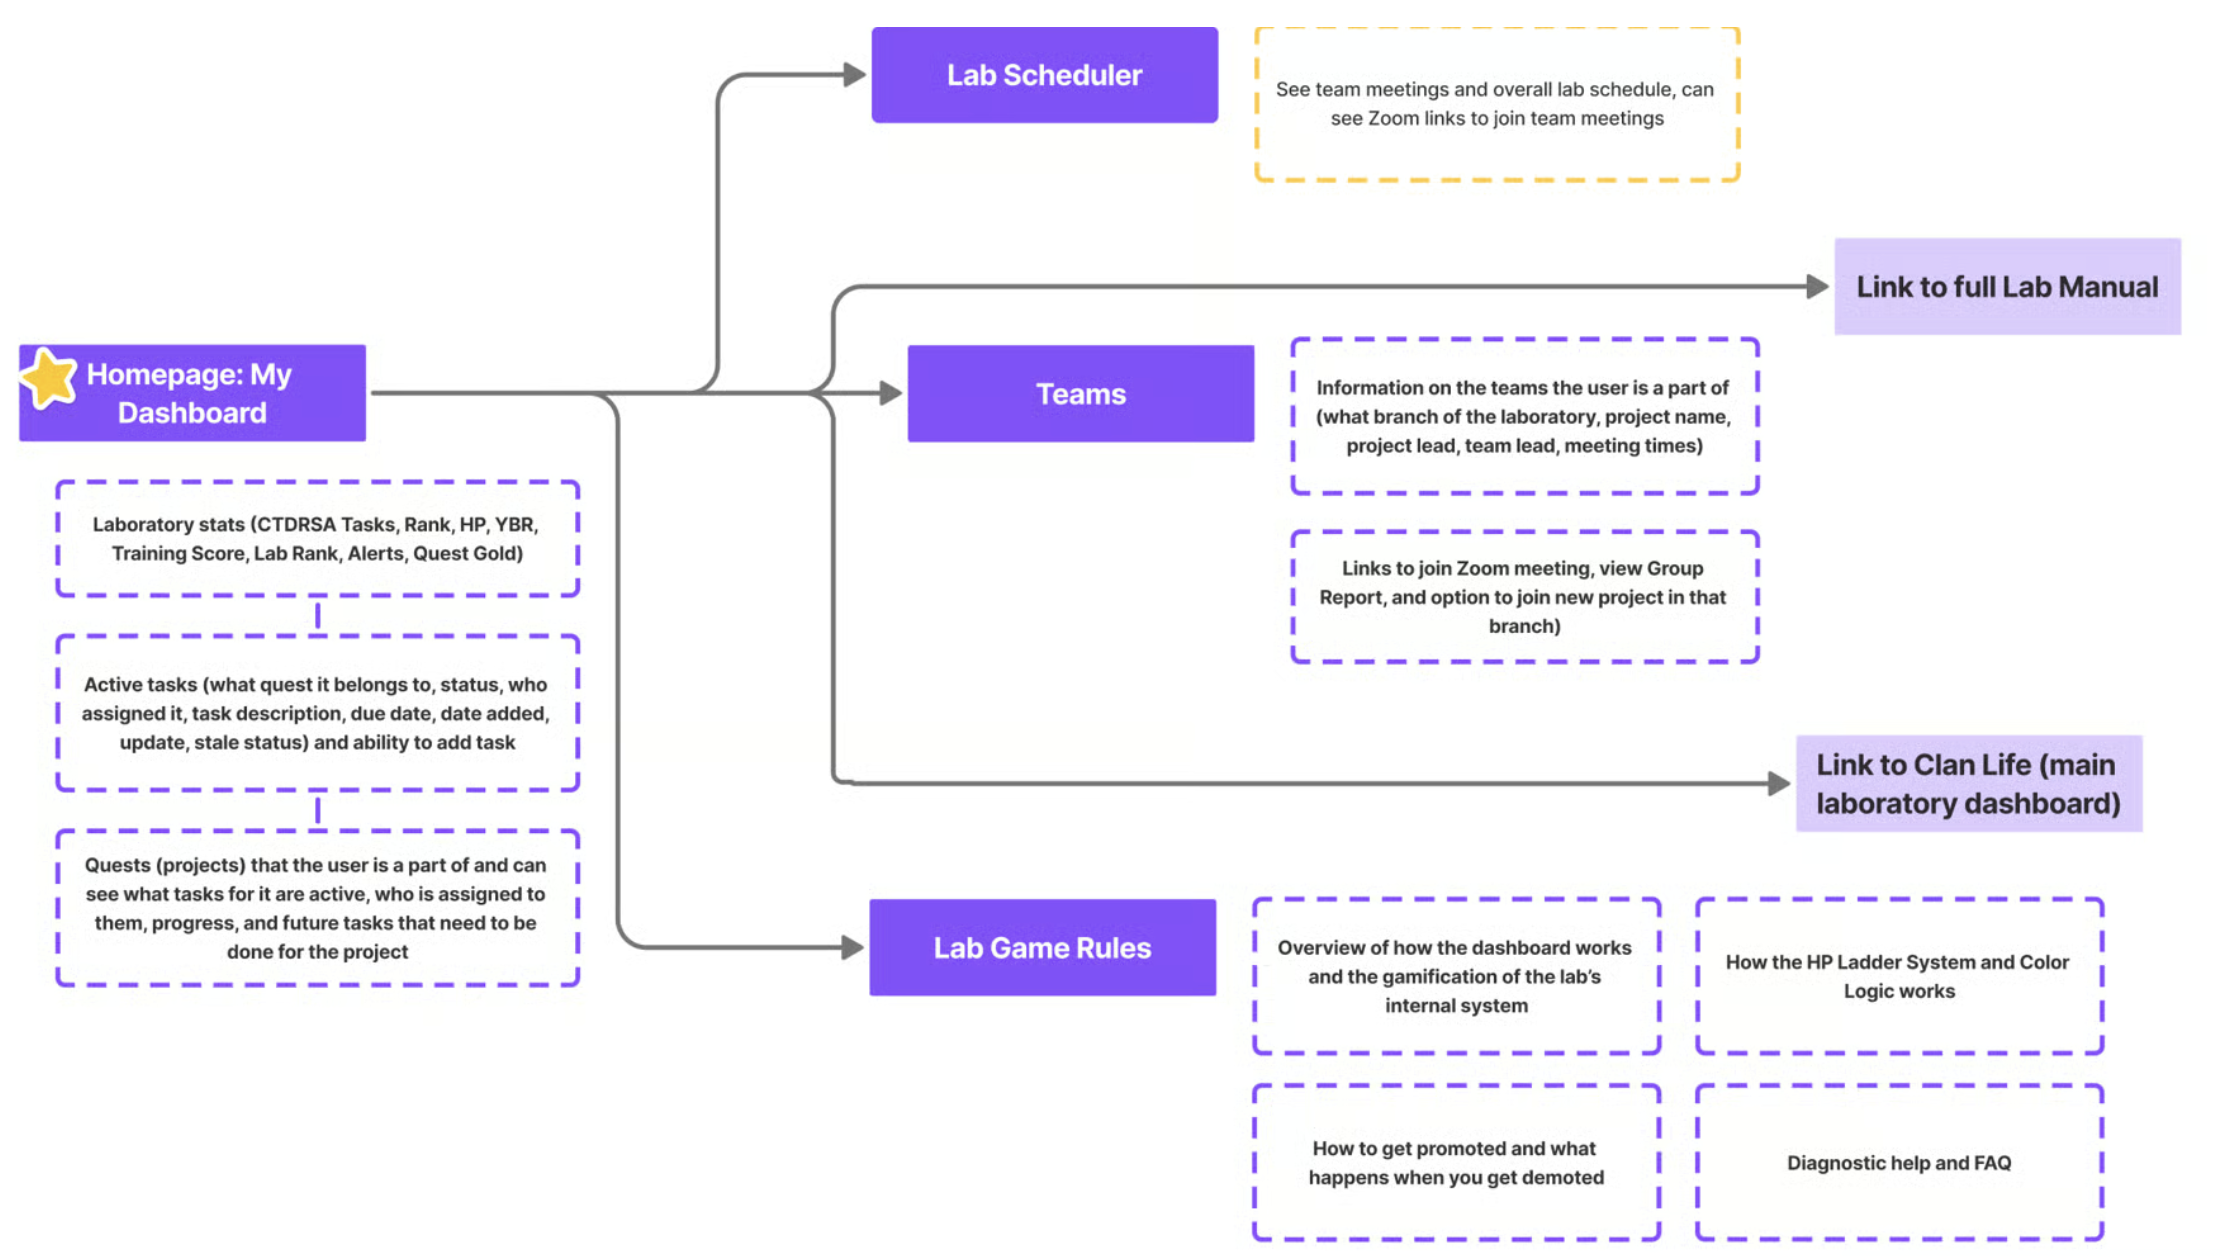
Rather than reproducing every spreadsheet as its own destination, I organized the system around three recurring needs: knowing what to do, knowing who to work with, and understanding the rules that govern progress. The dashboard provides the overview, while the scheduler, teams, and lab game rules support more focused tasks.
A purple-led system, referenced throughout.
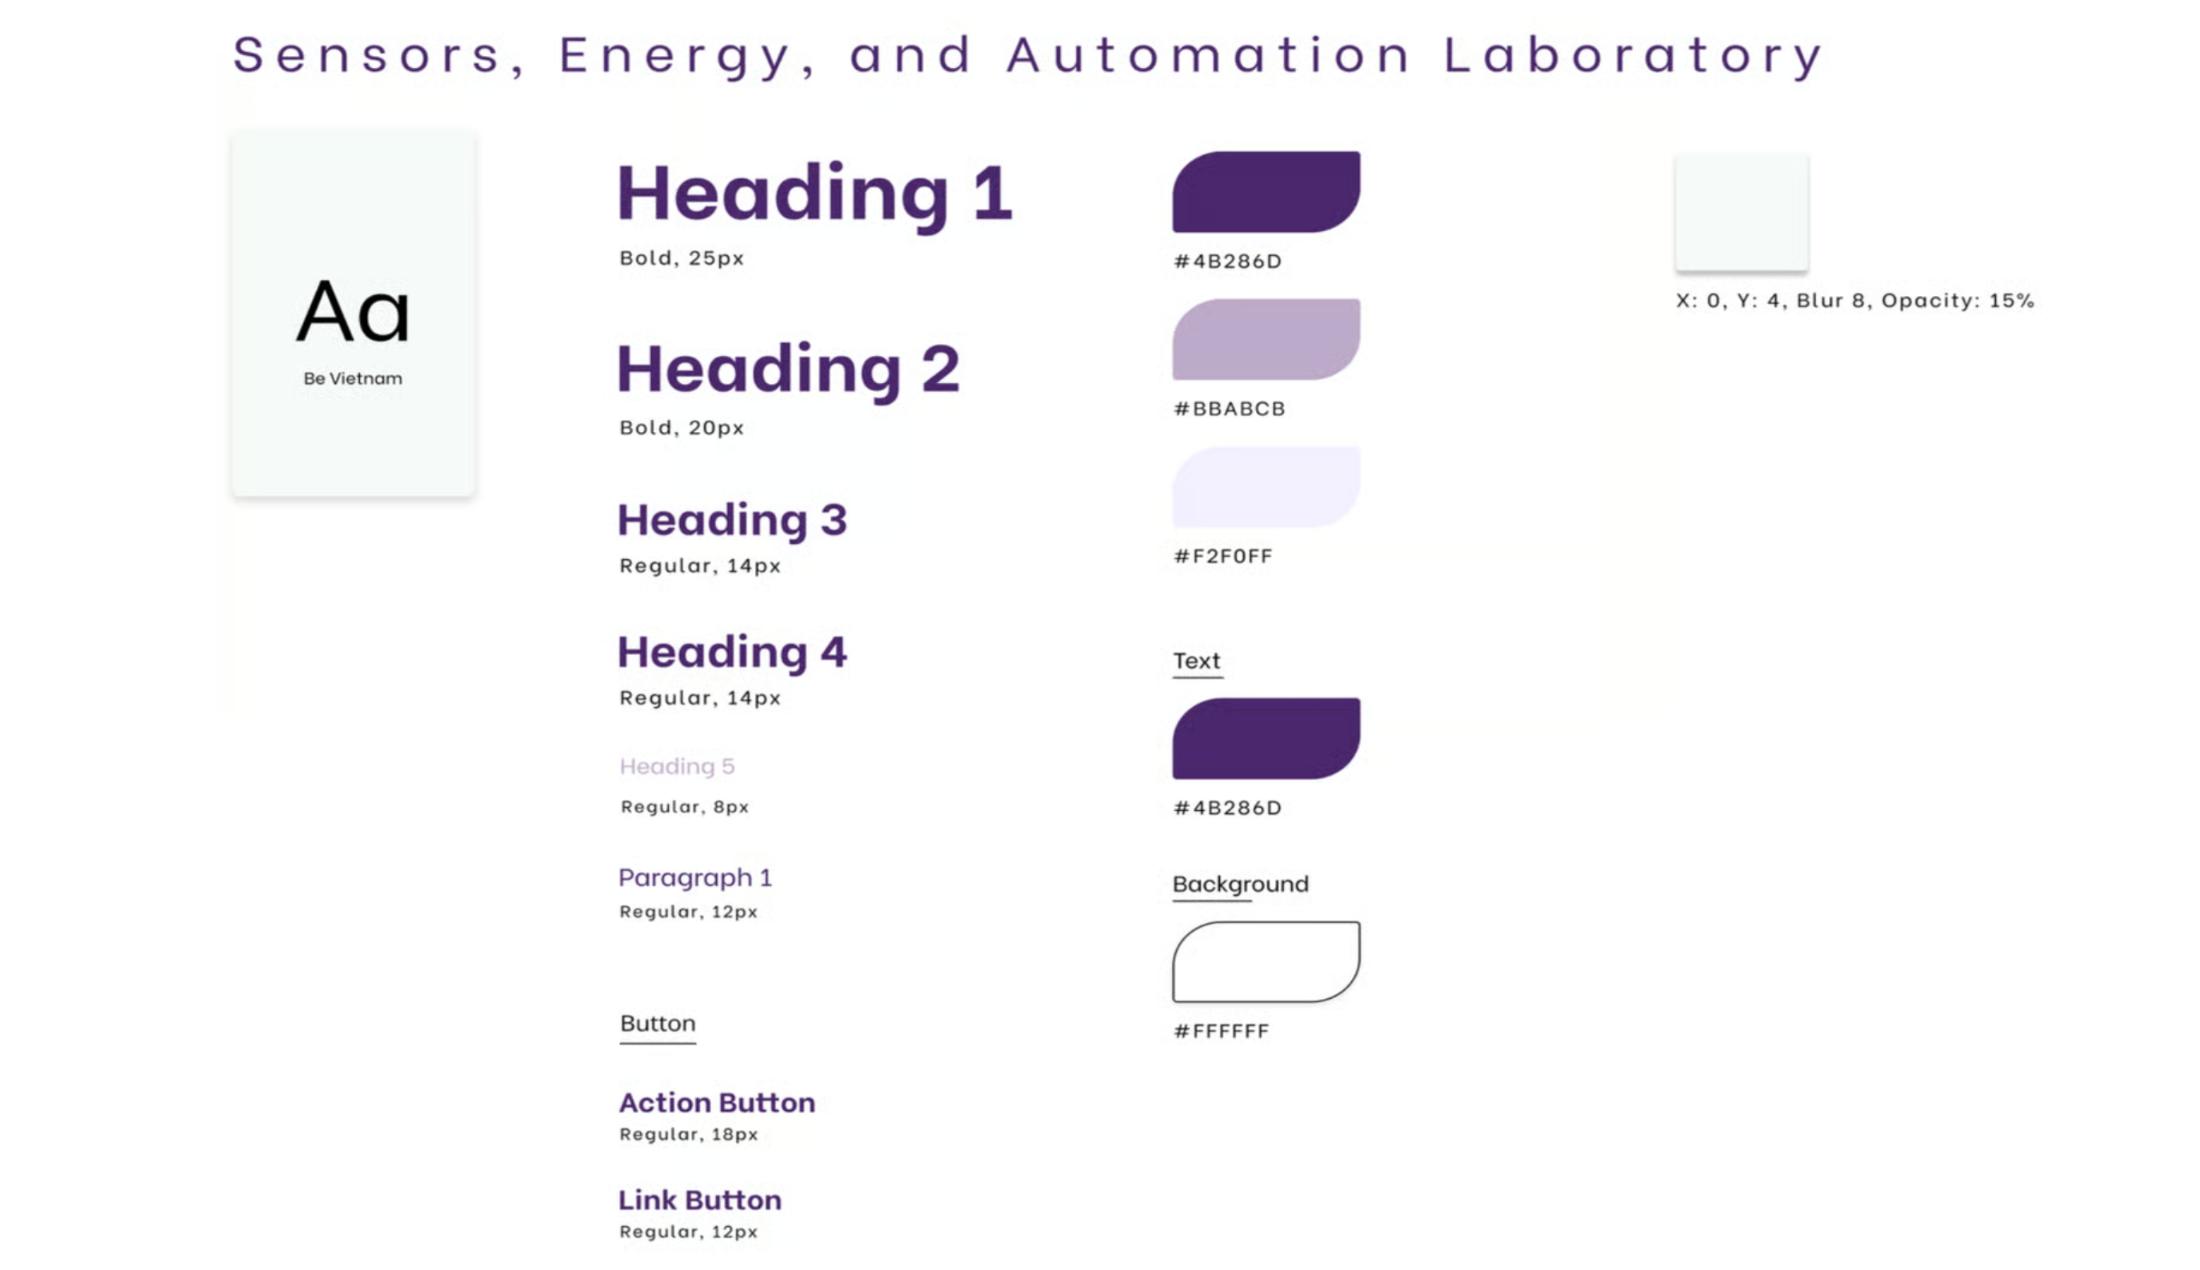
I built a style guide to keep the interface consistent as its workflows expanded. University of Washington purple anchored the visual system, while repeated component states and a shared type scale helped members recognize the same actions across the dashboard without relearning each screen.
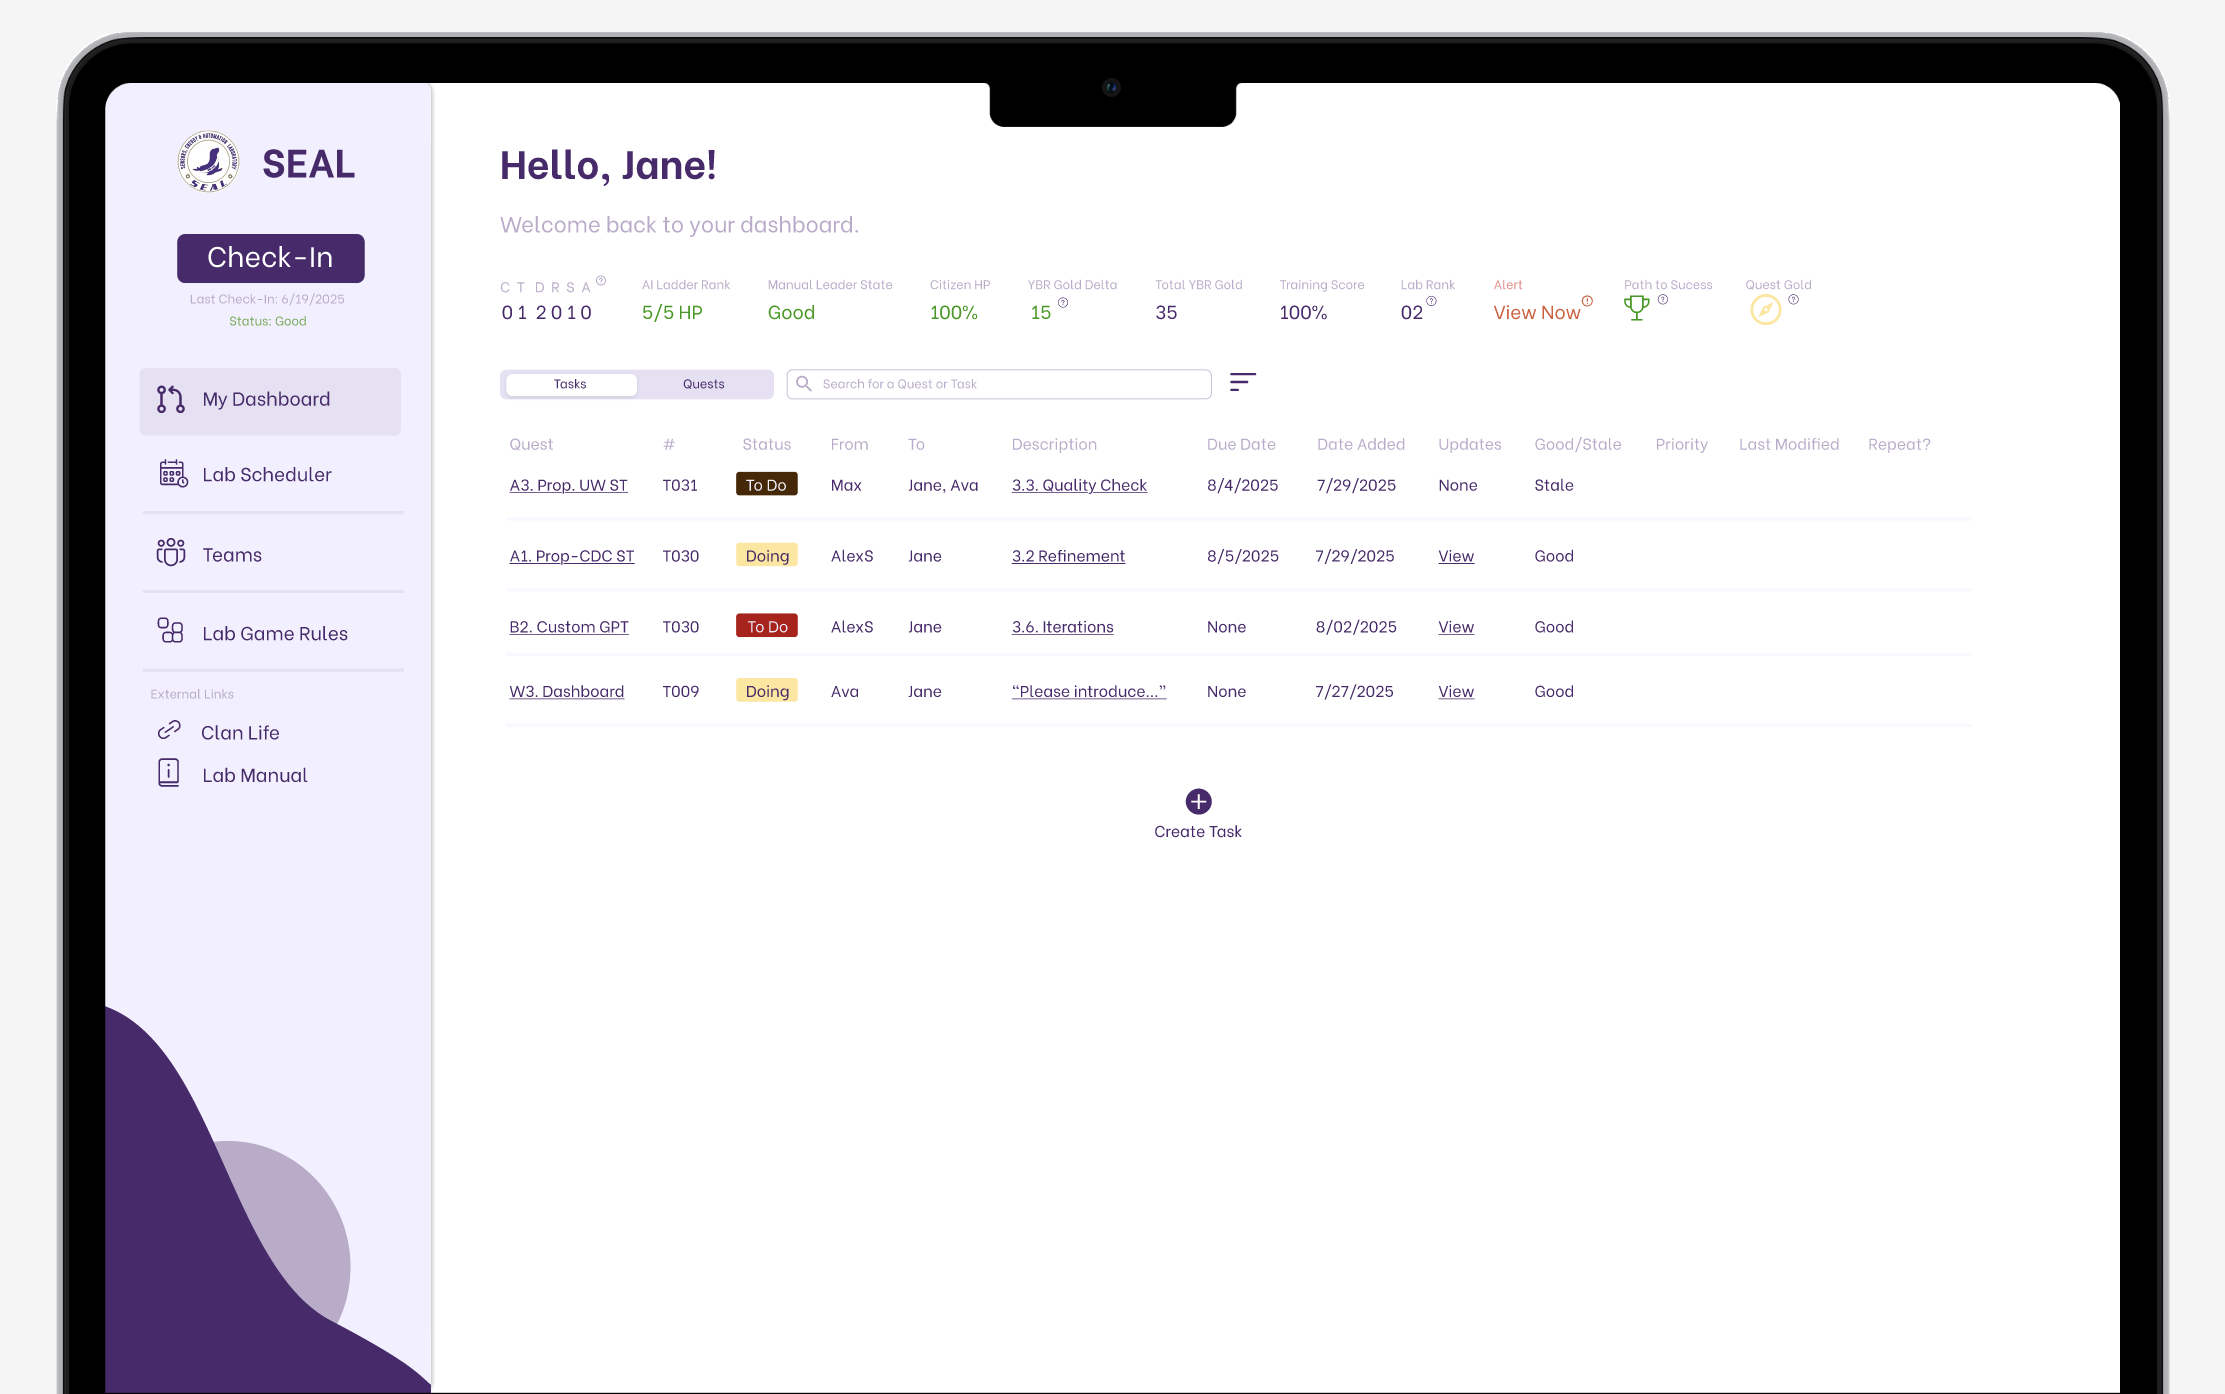
A single consolidated dashboard, organized around real workflows.
The redesigned information architecture brought core lab workflows into one dashboard. Final usability testing showed faster task completion and higher satisfaction. These results demonstrate improvements in the tested workflows; they do not establish a change in new-member retention.
Critical information prioritized
Research showed that switching between sheets created cognitive overload and made simple information difficult to find. I placed key status information in a predictable band at the top, made current tasks immediately legible, and moved secondary destinations into persistent side navigation.
Clear project timeline
Members had been building personal workarounds to understand project requirements. The "Quests" tab makes the full progression visible in one place, including each project, its required steps, and the people responsible for completing them.
Accessible calendar
I considered creating a custom scheduling pattern, but that would have introduced another system to learn. Modeling the experience after Google Calendar gave members a familiar way to see when teams meet and join meetings on time.
Easily accessible team info
New members could not rely on the informal knowledge that experienced members had accumulated. Centralizing team leaders, active projects, and joining options made that information discoverable without asking someone where to look.
"Get Green" lab summary
The lab's gamified rules were difficult to interpret when they were spread across resources. I compiled the requirements for staying in the optimal green zone in one searchable place so members could understand both their status and the action needed to improve it.
Testing changed what I considered successful design.
I initially saw visual polish as the project's main opportunity. Testing changed that assumption. Members valued fast access, legibility, and a clear overview more than a profile feature or decorative elements. I learned to judge each decision by how well it supported the way the lab actually operated, rather than how far the interface moved aesthetically from the original spreadsheets.
The strongest result was seeing previously confusing workflows completed with less hesitation during testing. Task completion became 73% faster, and satisfaction rose 4.5 points, from 3 to 7.5. The project taught me to make alternatives explicit, test them before investing in polish, and treat stakeholder priorities as hypotheses to evaluate alongside user behavior.
Diana was genuinely a godsend and revolutionized the results of the project. She transformed our previous dashboard into one that is accessible, beautiful, and functional, and tested thoroughly with lab members on both the current and updated designs, revising her wireframes from the feedback she received.
Diana breathed life into our new dashboard and was truly a pleasure to work with this summer.